The Institute’s 2026 Indicators Dashboard is presented in it's entirety here for your review. We are proud of this year's work and know you will find a host of invaluable insights. Thank you to all of the organizations that made our work possible.
Looking to go a bit deeper into these topics? Be sure to check out The Institute’s Task Force videos and other research briefs available on The Institute’s YouTube channel.
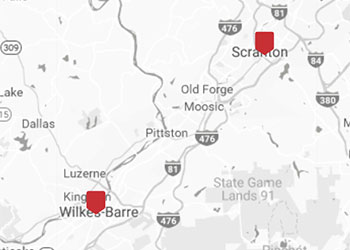
The Indicators Map has been updated for 2026. You can acess the new map by clicking below.
Note: You will be redirected to ESRI


The data dashboard is underwritten by the foundations that comprise Project STIR.