Social Services
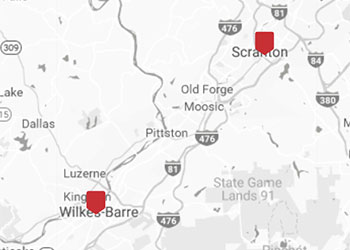
The Social Services section of the report covers indicators related to social service programs within Lackawanna, Luzerne, and Wayne counties and the Commonwealth of Pennsylvania. Social services include government-funded programs usually provided to those needing essentials, whether as a safety net or for ongoing services. Nonprofit organizations and private philanthropy also play an important role in the provision of these services to disadvantaged members of the community. Many health and social service programs face uncertainty about their future. Future data may show fluctuations due to eligibility or funding changes or may not be reported.
Numerous individuals throughout the region and the Commonwealth face physical, economic, and social challenges. The recipients of social services are often older individuals, those with mental and physical health challenges or disabilities, and lower-income families. Furthermore, the COVID-19 pandemic caused a spike in the acute need for support among families facing income loss. The pandemic appeared to widen already existing economic inequalities across gender, age, and race. Even as the economy returned to a growth trajectory overall, some households continue to fall through the cracks, and rising costs of essentials have made it more difficult for some to get ahead. While wages have improved, they do not necessarily represent a living wage for the region.
Under the Affordable Care Act, Pennsylvania expanded Medicaid to cover adults under 65 years with incomes up to 133 percent of the Federal Poverty Level. As a result, more people have become eligible for Medical Assistance (MA). After plateauing in 2018 and 2019, 2020 brought another spike in the share of those eligible for Medical Assistance. The number of individuals eligible for MA declined slightly in 2024, but the growth in prior years demonstrates ongoing issues with wages and affordable health care, even though employers. Statewide and regional enrollment in the Children’s Health Insurance Program (CHIP) has historically followed an upward trajectory. However, it has fallen from 2021 to 2023 as families shifted to Medicaid due to changes in income and eligibility.
Older Pennsylvanians also need social support. Many senior citizens live on fixed incomes and face significant health care issues. Within the three-county region, the percentage of the total population aged 65 years and older remains higher than the statewide percentage. The number of individuals with a disability has remained relatively steady, with a slight decrease in 2023, indicating a continued need for support for a variety of disabilities.
Several federal income tax credits are like social assistance programs. The Earned Income Tax Credit (EITC) can provide significant income, in the form of a tax refund, to lower-income households. On average, about 15.0 percent of regional tax returns included the EITC in 2022. The share of households receiving Child Tax Credits and the average amount of credit per return grew due to the expansion of that credit under the Tax Cuts and Jobs Act. However, there were significant declines regionally and statewide in 2022. Additional tax credits and direct payments from 2020 to 2022 also made a temporary but meaningful impact on families' financial situations.
View Indicators Map

